4.2 THRUST CHAMBER PERFORMANCE PARAMETERS
The significance of the parameters which express or influence the efficiency of thrust chamber operation has been discussed in section 1.3 of chapter I. Before discussing the details of actual thrust chamber design, the following summarizes these parameters and illustrates their use for design calculations by applying them to the engine systems of the Alpha vehicle which was discussed in chapter III.
Specific Impulse,
From equations 1-31 and 1-31c:
The specific impulse figure indicates the overall quality of the thrust-chamber design. As was learned earlier, it shows how much thrust is generated for what "running propellant expenditures."
Characteristic Velocity, c* (ft/sec)
From equation 1-32a:
Assuming that the propellant and mixture ratio selection has been made, it can be expected that the gas properties ( ) will fall into a known band. From there on, almost entirely depends on the temperature of the gases. Obviously, this temperature has a theoretical maximum for a selected propellant combination. How close to this maximum the chamber will operate depends on influences discussed for mixture ratio in chapter II. Figures , and illustrate this. It is seen that peaks at combustion temperatures somewhat lower than maximum. Other considerations, such as bulk densities, which affect vehicle tank sizes, may cause further adjustments of the mixture ratio for optimum overall vehicle performance. Within these boundaries, the quality of the combustion process greatly depends on the design efficiency of a thrust chamber assembly, in particular the injector.
Thrust Coefficient, (dimensionless)
From equation 1-33a:
Let us assume that the performance of energy generation through the combustion process, the effects of which were just summarized for . has been determined. Then, with a given gas property ( ), the performance of the remaining thrust generating functions of the thrust chamber, essentially those of the divergent nozzle, will depend on the nozzle geometry (mainly which determines the pressure ratio and the ambient pressure ( ).
Performance Calculation
In actual design practice, the calculation of the thrust chamber performance is based on theoretical propellant combustion data and the application of certain correction factors as explained in chapter I. The theoretical propellant combustion data are derived from thermochemical computations which equate the heat of reaction of the propellant combination and the rise in enthalpy of the combustion gases. Typical propellant combustion data at frozen composition are presented in figures through 4-6. For given propellant combinations and chamber-nozzle stagnation pressures , the values for the combustion gas temperature , molecular weight , and specific heat ratio are plotted against the mixture ratio . Performance correction factors are determined by the theoretical assumptions and from earlier test data, as well as from the chosen design configurations. Typical performance calculation methods have
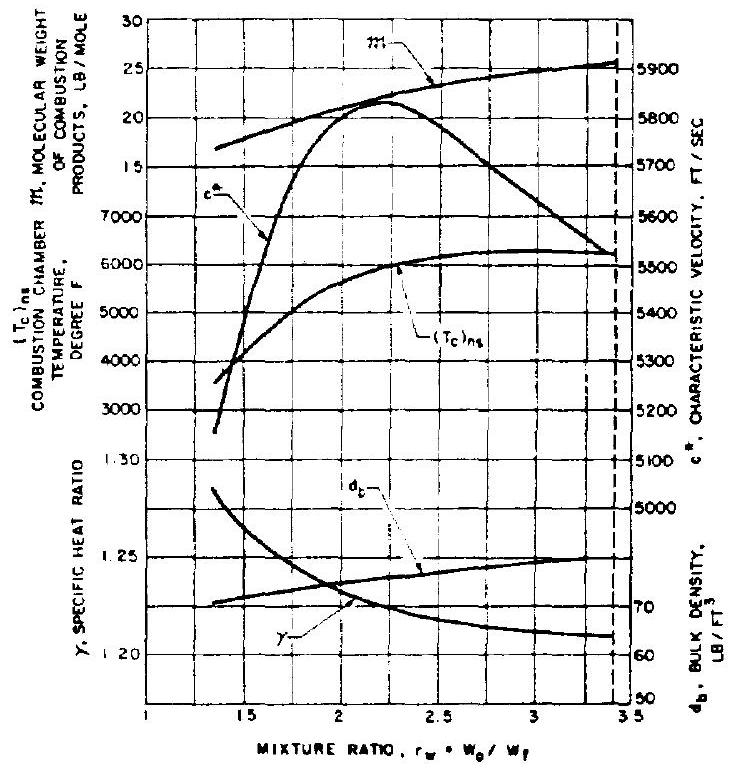 Figure 4-3.-Theoretical combustion data (frozen composition), .
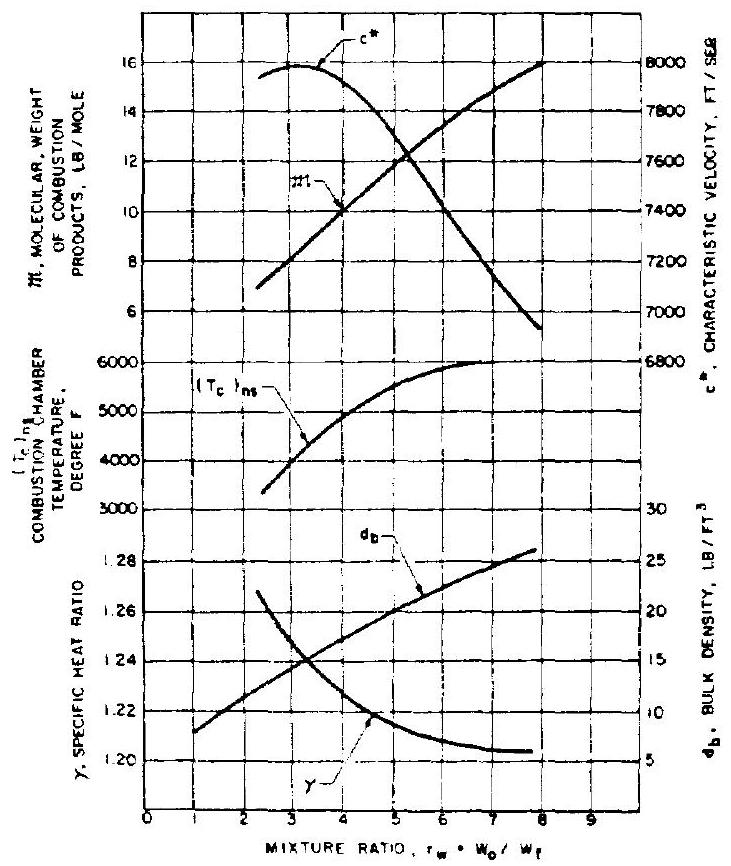 Figure 4-4.-Theoretical combustion data (frozen composition), .
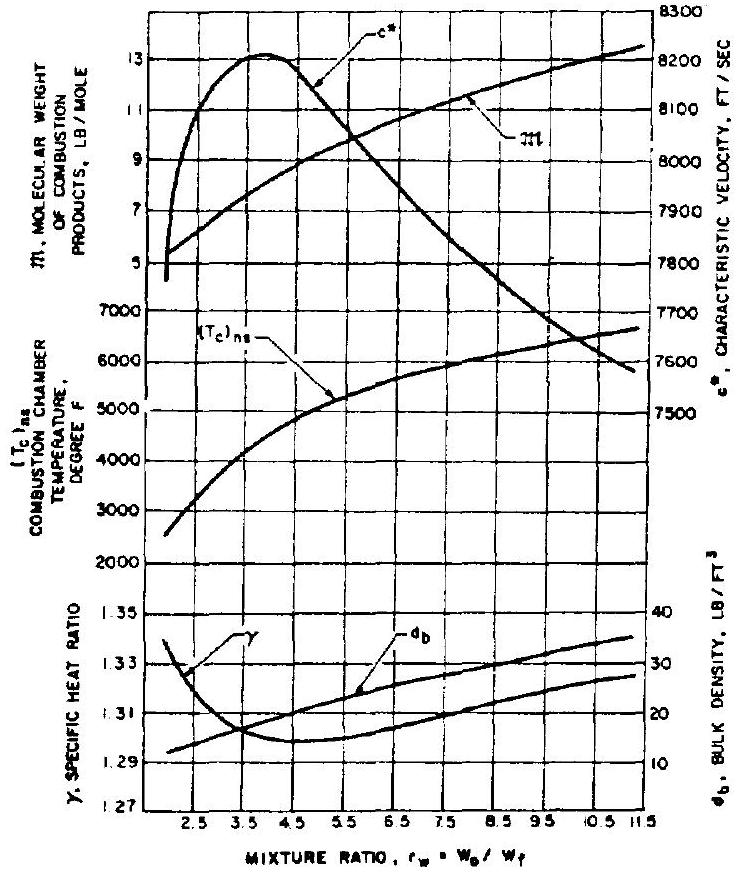 Figure 4-5.-Theoretical combustion data (frozen composition), .
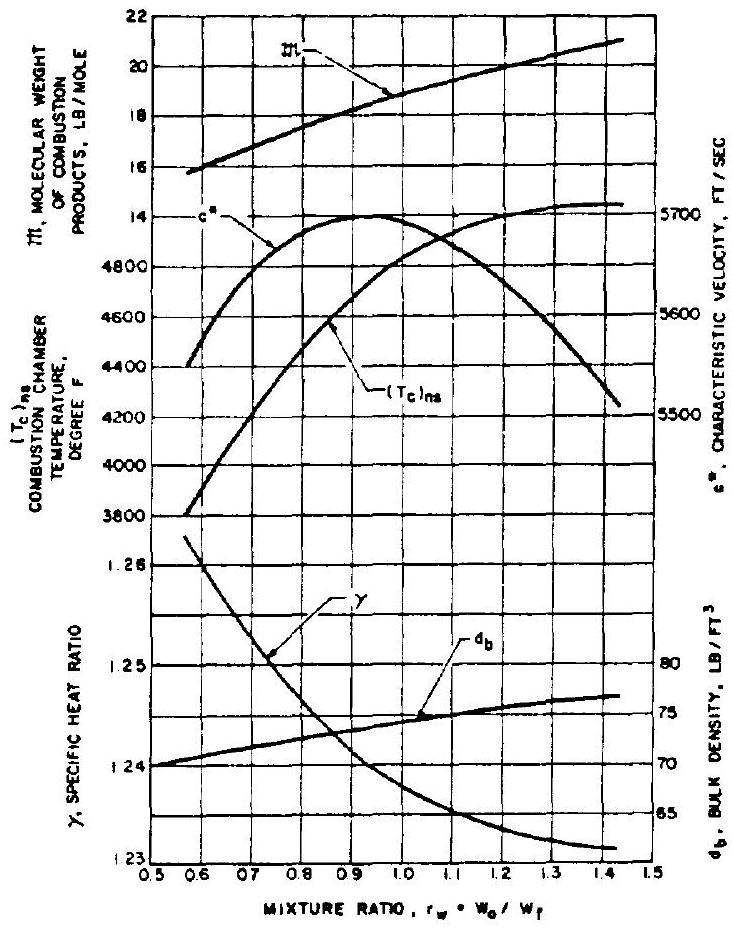 Figure 4-6.-Theoretical combustion data (frozen composition), .
been demonstrated earlier by sample calculation (1-3). The following sample calculations illustrate the more specific approaches.
Sample Calculation (4-1)
Determine the design values of , and for the engine thrust chambers of the stages of the hypothetical Alpha vehicle, with the following assumed design parameters: (a) 750 K A-1 Stage Engine:
Propellants, ; thrust chamber O/F mixture ratio, 2.35; psia; propellant combustion data, figure 4-3; nozzle expansion area ratio, . (b) A-2 Stage Engine:
Propellants, ; thrust chamber O/F mixture ratio, psia; propellant combustion data, figure 4-4; nozzle expansion area ratio, .
Solutions
(a) A-1 Stage Engine:
From figure 4-3 for at psia and a mixture ratio of 2.35 , the following values are derived for the chamber product gases:
Substitute into equation (1-32a): Theoretical
This value for can also be derived from figure 4-3.
For a good combustion chamber and injector design, the correction factor for and frozen composition will be about 0.975 .
Design c* For , a theoretical vacuum value of 1.768 can be derived from figure 1-11:
Sea level can also be calculated using equation (1-33a), with the aid of equation (1-20).
With effective nozzle contour design, an overall correction factor of 0.98 for frozen composition can be used.
Design sea level From equation (1-31c): Design sea level (b) A-2 Stage Engine:
From figure for at psia and a mixture ratio of 5.22 , the following values are derived for the chamber product gases: or ,
Substitute into equation (1-32a): Theoretical
Based on experimental data, a correction factor can be assumed for the frozencomposition data of about 0.975 .
For , a theoretical vacuum value of 1.876 can be derived from figure 1-11. can also be calculated using equations (1-33a) and (1-20). With effective nozzle contour design, an overall correction factor value of 1.01 can be used for frozen-composition data:
Design vacuum From equation (1-31c): Design vacuum The reader should perform his own calculations for the A-3 and the A-4 engines, with the aid of tables 3-4 and 3-5, and figures 4-5 and 4-6.